CMU 15-112: Fundamentals of Programming and Computer Science
Class Notes: Graphics in Tkinter
Notes
- We will only run graphics in Standard Python. These examples will not run in Brython.
- The standard Python documentation for tkinter can be hard to read. You can find our preferred documentation here (see chapter 8 on 'The Canvas Widget').
- To run these examples, first download cmu_112_graphics.py and be sure it is in the same folder as the file you are running.
- That file has version numbers. As we release updates, be sure you are using the most-recent version!
- Some prior semesters use a slightly different framework. Be aware of this if you are reviewing previous semesters' materials, especially prior to F19!
- The videos are still from a prior semester, so you may notice a change in the names of the functions used in the videos, but they serve the same purpose. Also, we now use the app.width and app.height properties to get canvas dimensions (instead of just width and height as function arguments)
Trig 101
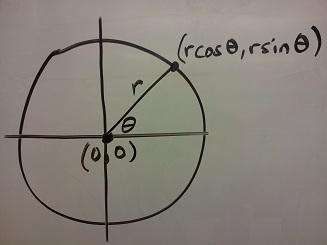
- Circle centered at origin
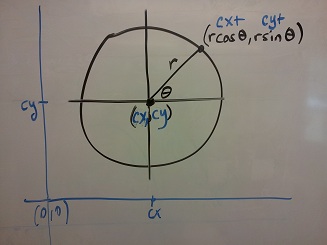
- Circle centered at (cx, cy)
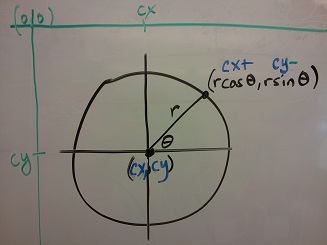
- Circle centered at (cx, cy) in Python graphics ('up is down!')
Example:
from cmu_112_graphics import *
import math
def redrawAll(app, canvas):
(cx, cy, r) = (app.width/2, app.height/2, min(app.width, app.height)/3)
canvas.create_oval(cx-r, cy-r, cx+r, cy+r, fill='yellow', outline='black')
r *= 0.85 # make smaller so time labels lie inside clock face
for hour in range(12):
hourAngle = math.pi/2 - (2*math.pi)*(hour/12)
hourX = cx + r * math.cos(hourAngle)
hourY = cy - r * math.sin(hourAngle)
label = str(hour if (hour > 0) else 12)
canvas.create_text(hourX, hourY, text=label,
font='Arial 16 bold', fill='black')
runApp(width=400, height=400)
Result: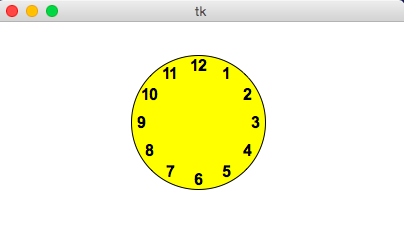
from cmu_112_graphics import *
import math
def drawClock(canvas, x0, y0, x1, y1, hour, minute):
# draw a clock in the area bounded by (x0,y0) in
# the top-left and (x1,y1) in the bottom-right
# with the given time
# draw an outline rectangle
canvas.create_rectangle(x0, y0, x1, y1, outline='black', width=1)
# find relevant values for positioning clock
width = (x1 - x0)
height = (y1 - y0)
r = min(width, height)/2
cx = (x0 + x1)/2
cy = (y0 + y1)/2
# draw the clock face
canvas.create_oval(cx-r, cy-r, cx+r, cy+r, outline='black', width=2)
# adjust the hour to take the minutes into account
hour += minute/60.0
# find the hourAngle and draw the hour hand
# but we must adjust because 0 is vertical and
# it proceeds clockwise, not counter-clockwise!
hourAngle = math.pi/2 - 2*math.pi*hour/12
hourRadius = r*1/2
hourX = cx + hourRadius * math.cos(hourAngle)
hourY = cy - hourRadius * math.sin(hourAngle)
canvas.create_line(cx, cy, hourX, hourY, fill='black', width=1)
# repeat with the minuteAngle for the minuteHand
minuteAngle = math.pi/2 - 2*math.pi*minute/60
minuteRadius = r*9/10
minuteX = cx + minuteRadius * math.cos(minuteAngle)
minuteY = cy - minuteRadius * math.sin(minuteAngle)
canvas.create_line(cx, cy, minuteX, minuteY, fill='black', width=1)
def redrawAll(app, canvas):
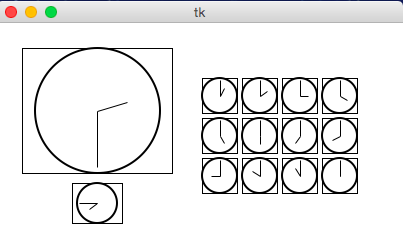
# Draw a large clock showing 2:30
drawClock(canvas, 25, 25, 175, 150, 2, 30)
# And draw a smaller one below it showing 7:45
drawClock(canvas, 75, 160, 125, 200, 7, 45)
# Now let's have some fun and draw a whole grid of clocks!
width = 40
height = 40
margin = 5
hour = 0
for row in range(3):
for col in range(4):
left = 200 + col * width + margin
top = 50 + row * height + margin
right = left + width - margin
bottom = top + height - margin
hour += 1
drawClock(canvas, left, top, right, bottom, hour, 0)
runApp(width=400, height=400)
Result: